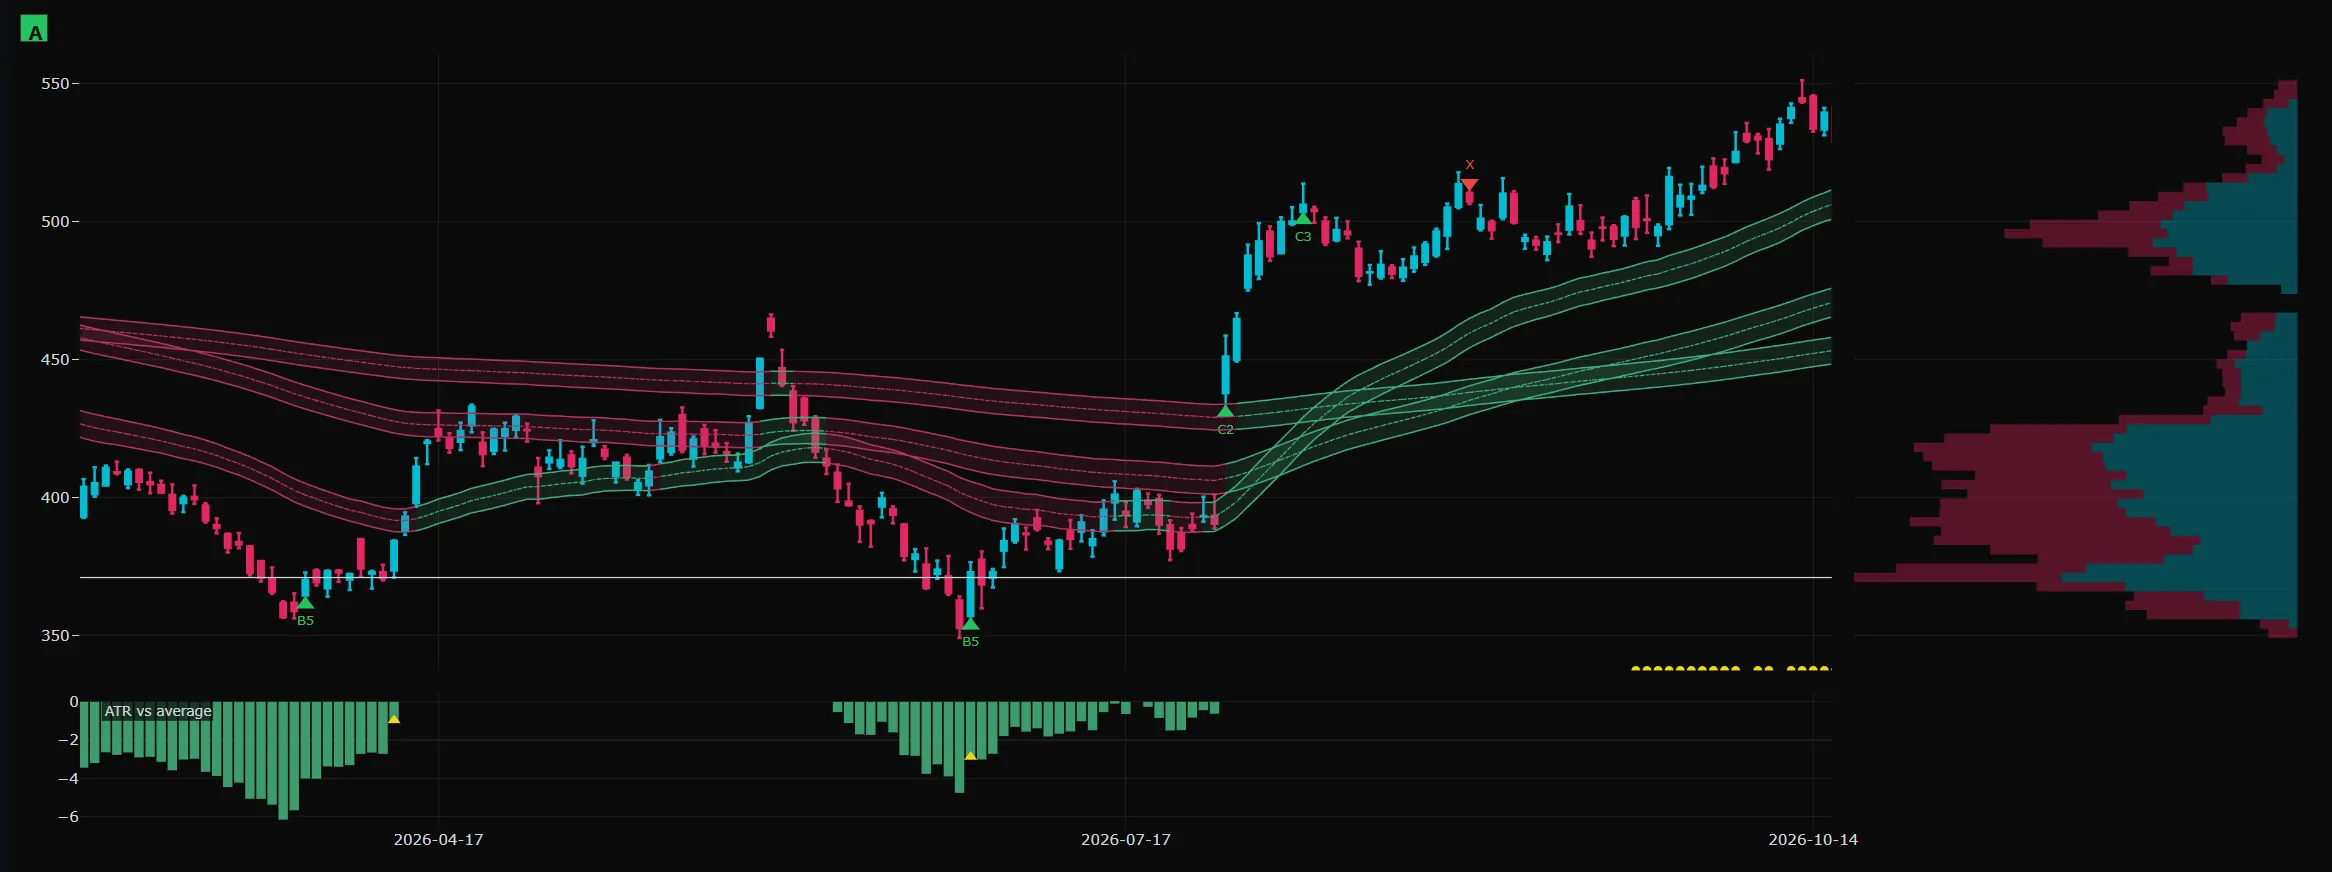
O8Radar scans the 800 most-traded US stocks every trading day, colours the trend, rates every signal and shows the busiest prices, on daily and 4-hour charts.
Demonstration chart. Not a real stock or a real signal.
Trend colourGreen is strong, red is weakening.
Buy signalsWatch, Buy or Strong Buy.
Sell signalsTrim, Exit or Strong Exit.
Volume profileThe busiest prices, as bars.
Plan boxTarget above, stop below.
800
most-traded US stocks scanned every trading day
1D + 4H
daily and 4-hour charts, for more chances inside every trend
1 plan
with every buy: a target, a stop and a size
0
signals redrawn after the fact
A marker never moves once it appears
Read the trend in one glance.
Every chart carries a trend ribbon. It turns green while a stock’s trend is strong and red when the trend starts to weaken, so you can check a whole watchlist in minutes and spot the moment a stock begins to recover.
Green: the trend is strong
Red: the trend is weakening
Red turning green: a recovery is starting
The trend ribbon
Illustration of one stock’s trend over time.
Signals that tell you how strong they are.
A signal on its own isn’t enough. Every buy and every sell arrives with a rating and the reasons it fired, so you know how much conviction is behind it before you act.
Buys run from Watch to Strong Buy
Sells run from Caution to Strong Exit
Trim locks in part of the profit while the rest keeps running
Every signal has a rating
Shown on the chart exactly as below.
Buy signals
WATCHBUYSTRONG BUY
From an early heads-up to the system’s highest conviction.
Sell signals
CAUTIONTRIMEXITSTRONG EXIT
From a warning that things are weakening to a clear sign the trade is finished.
See where the crowd stands.
The bars on the right edge of every chart show how much trading happened at each price. Thick bars mark prices the market cares about, and the brightest bar is the busiest price of all. Use them to judge where to enter, where to put your stop and where a move may pause or turn.
Thick bars: prices where the crowd has been active
Thin zones: prices where a move tends to be quick
Brightest bar: the busiest price on the chart
Volume profile
Illustration. Each bar is the trading at one price.
$142
$132
$122
$112
$102
Busiest price
Where most trading happened
Thin zones
Daily and 4-hour charts, for more chances.
O8Radar reads both the daily chart and the 4-hour chart. The daily view shows the big picture. The 4-hour view finds more opportunities inside every trend, using the same rules and the same standard for a signal.
More opportunities without lowering the bar
The same ratings, ribbons and plan boxes on both
Switch between them on any stock
Two views, one set of rules
Switch any chart in a click.
1DDailyThe big picture: the trend, the levels and the setups that take shape over days.
4H4-hourMore chances: sharper entries and exits inside the same trend.
A plan turns fear into arithmetic.
Losing on a trade isn’t what hurts traders. Not knowing how much they could lose is. Every O8Radar buy comes with a target, a stop and a size before you enter, so you know your risk and your reward in advance and there is nothing left to be afraid of.
Make a plan for every trade and the numbers work for you, as long as what you win outweighs what you lose, in size and in how often. A small, planned loss is simply the cost of finding the next winner.
The arithmetic is simple. Risk $1 to make $2 and you come out ahead by being right just over one time in three, before costs. Fear belongs to trades with no plan.
Every buy comes with a plan
Set before you enter, drawn on the chart.
TargetWhere gains get locked in, set before you buy.
EntryA rated setup, shown with the reasons it fired.
StopWhere the idea is proven wrong, so a small loss stays small.
SizeShares sized to your own risk setting.
Everything in one place.
A daily brief, charts, watchlists, positions and a journal live together in one members’ area, so a good routine takes minutes, not hours.
Daily briefEvery trading day, the best setups and exit warnings on one readable page, with the reasons.
ChartsDaily and 4-hour charts with trend ribbons, signal markers, plan boxes and a volume profile.
Watchlists and alertsFollow your own names and see when something changes.
Positions and journalRecord each trade you take, track it against its plan and write down why.
Your recordSee your own results by source of idea, next to what each system did.
Weekly reviewA plain look back at what worked and what didn’t.
In action.
Real charts from the system. Every marker sits exactly where the system placed it at the time, winners and losers alike.
Every entry and exit, labelled
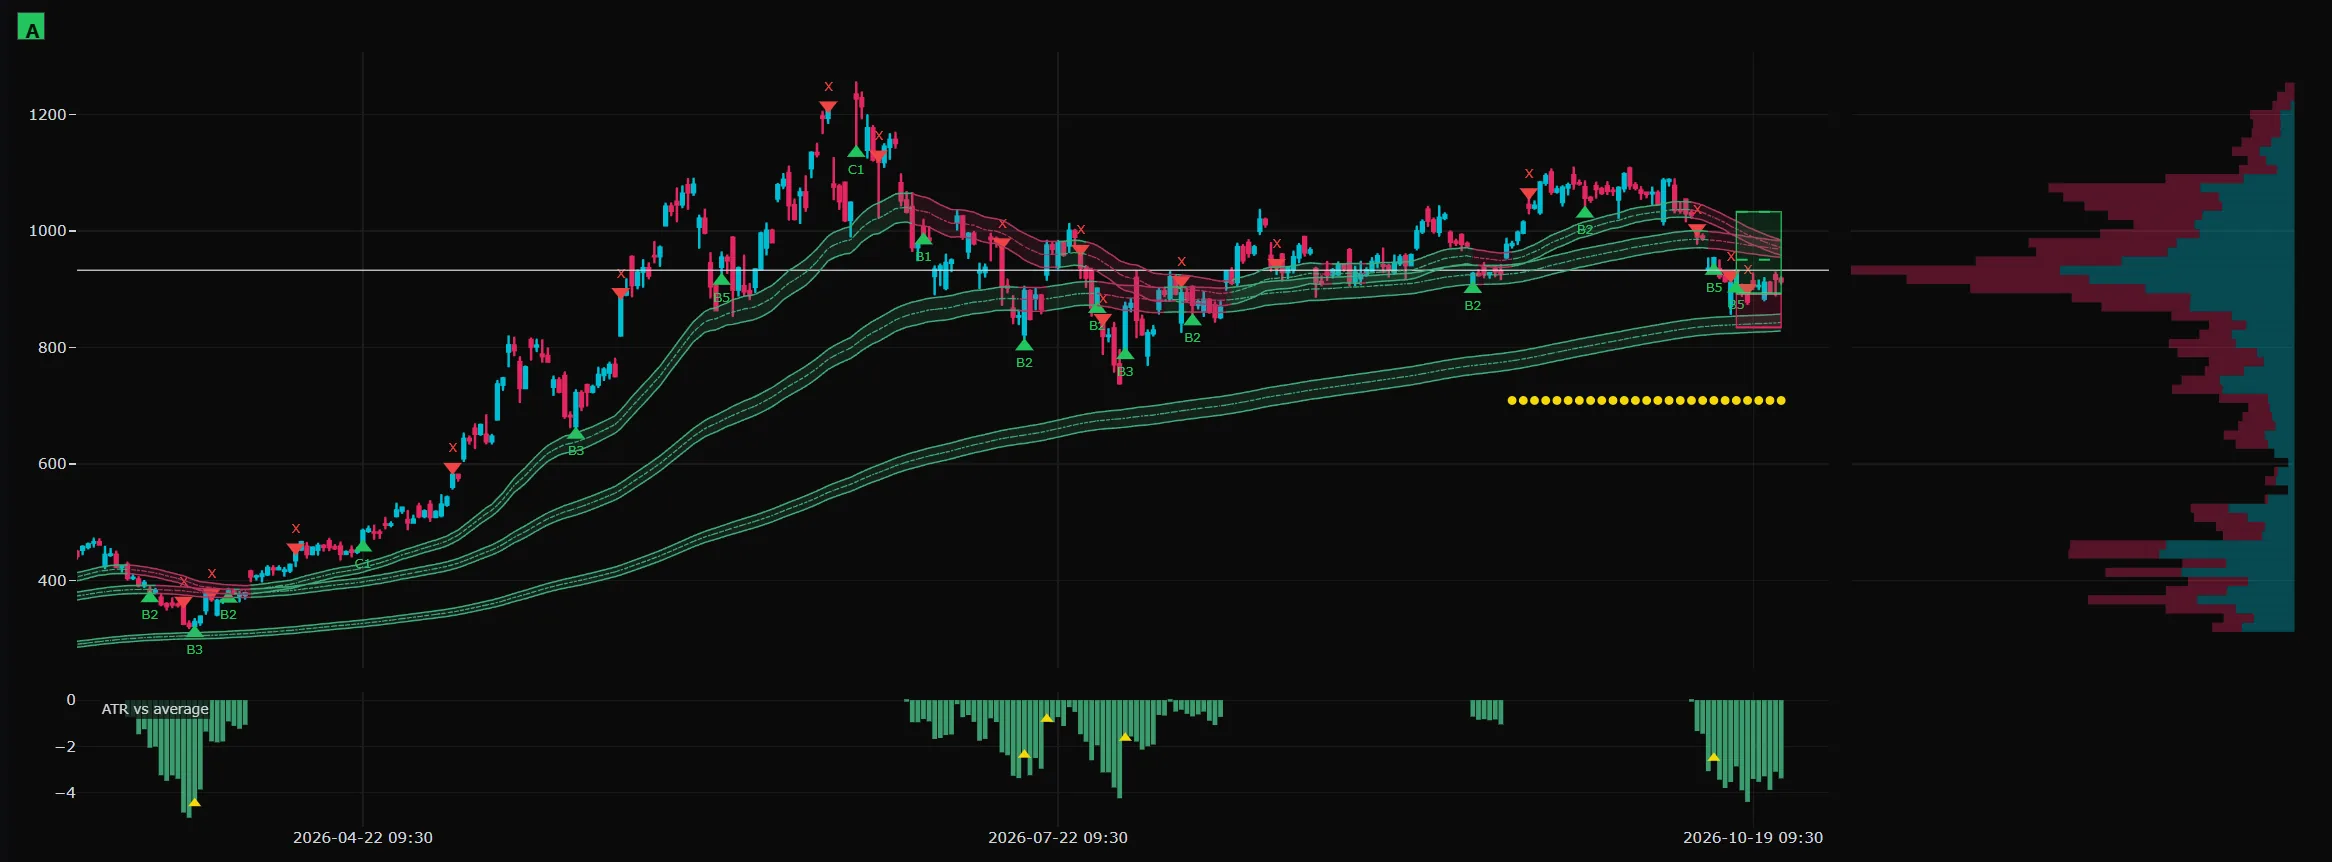
Micron, MU
Entries carry their setup type and exits carry a red marker, exactly where the system placed them at the time. The box on the latest bar is the plan for the newest signal: green up to the target, red down to the stop. The panel below tracks volatility against its average.
The trend turns
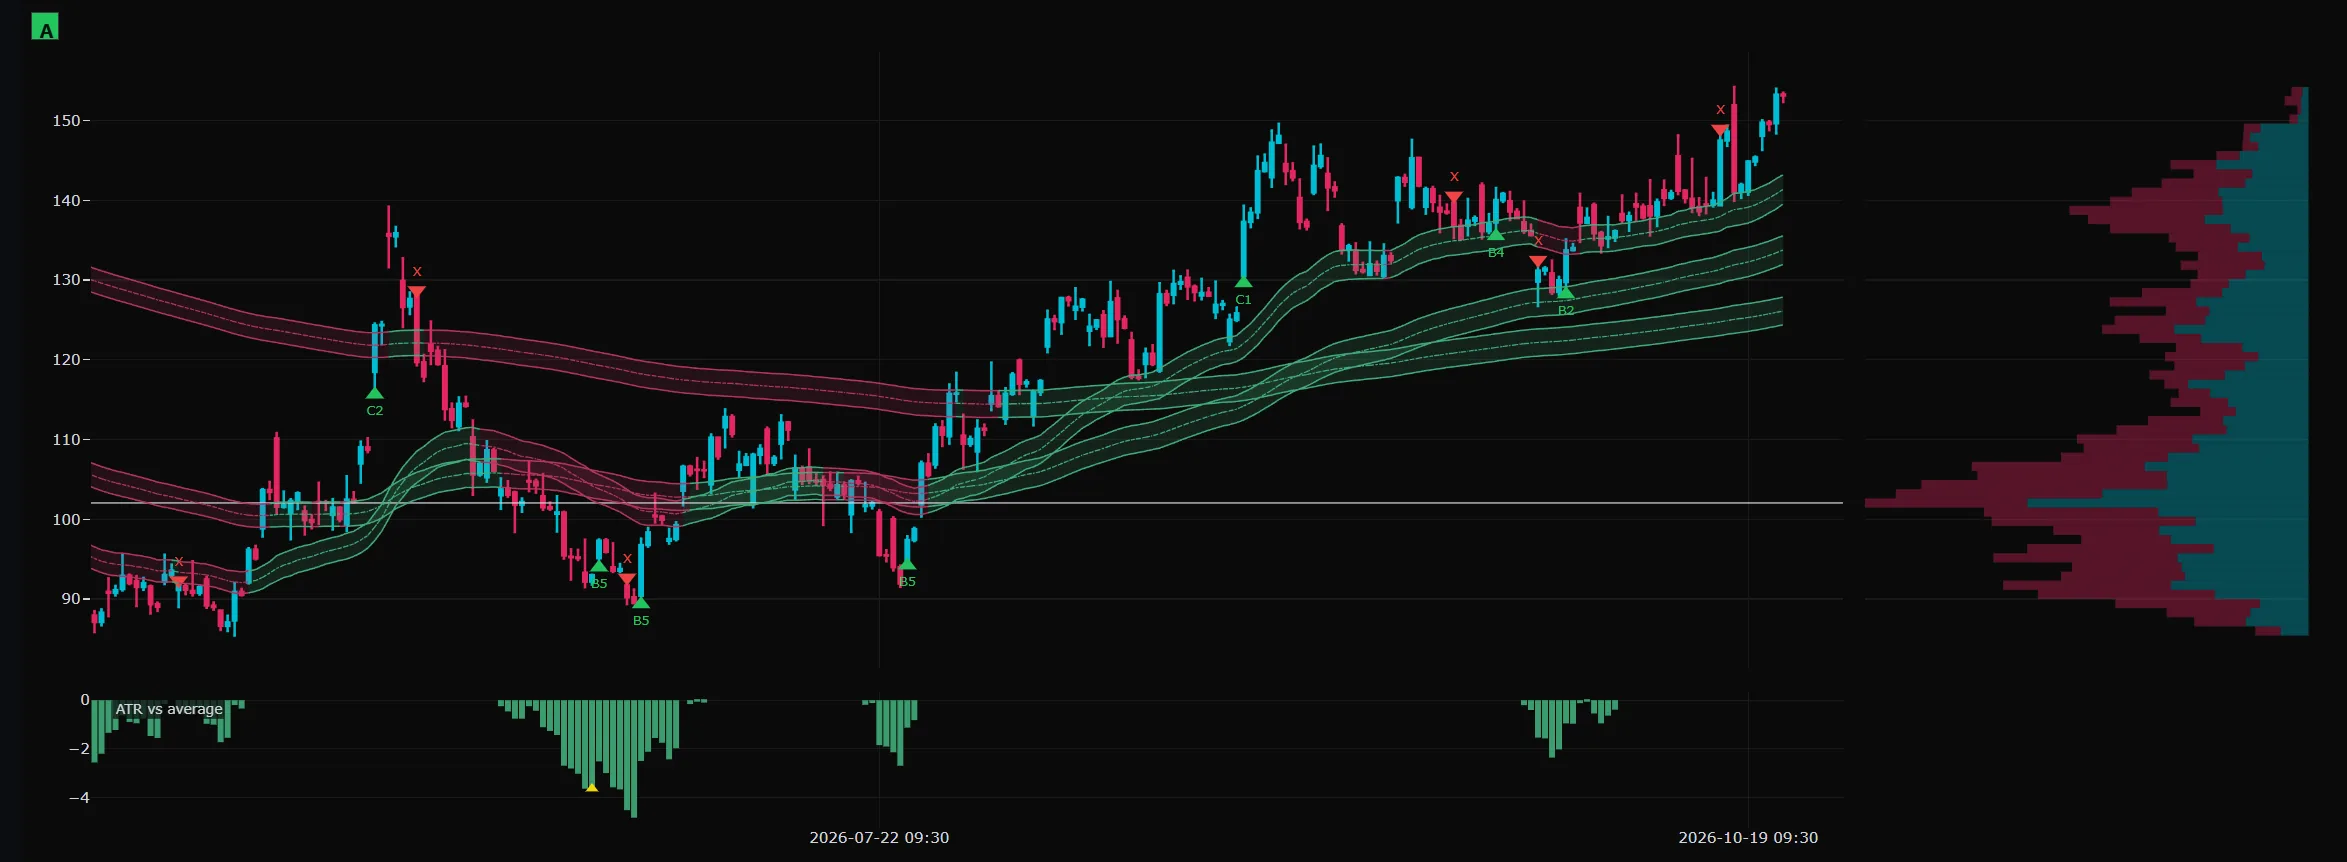
ServiceNow, NOW
For months the ribbons are red and the price drifts lower. Entries are marked along the way down, and once the ribbons turn green and start to climb, the chart shows further entries and exits on the way up. Not every entry works, and the chart keeps those in view too.
A sharp drop, then a recovery
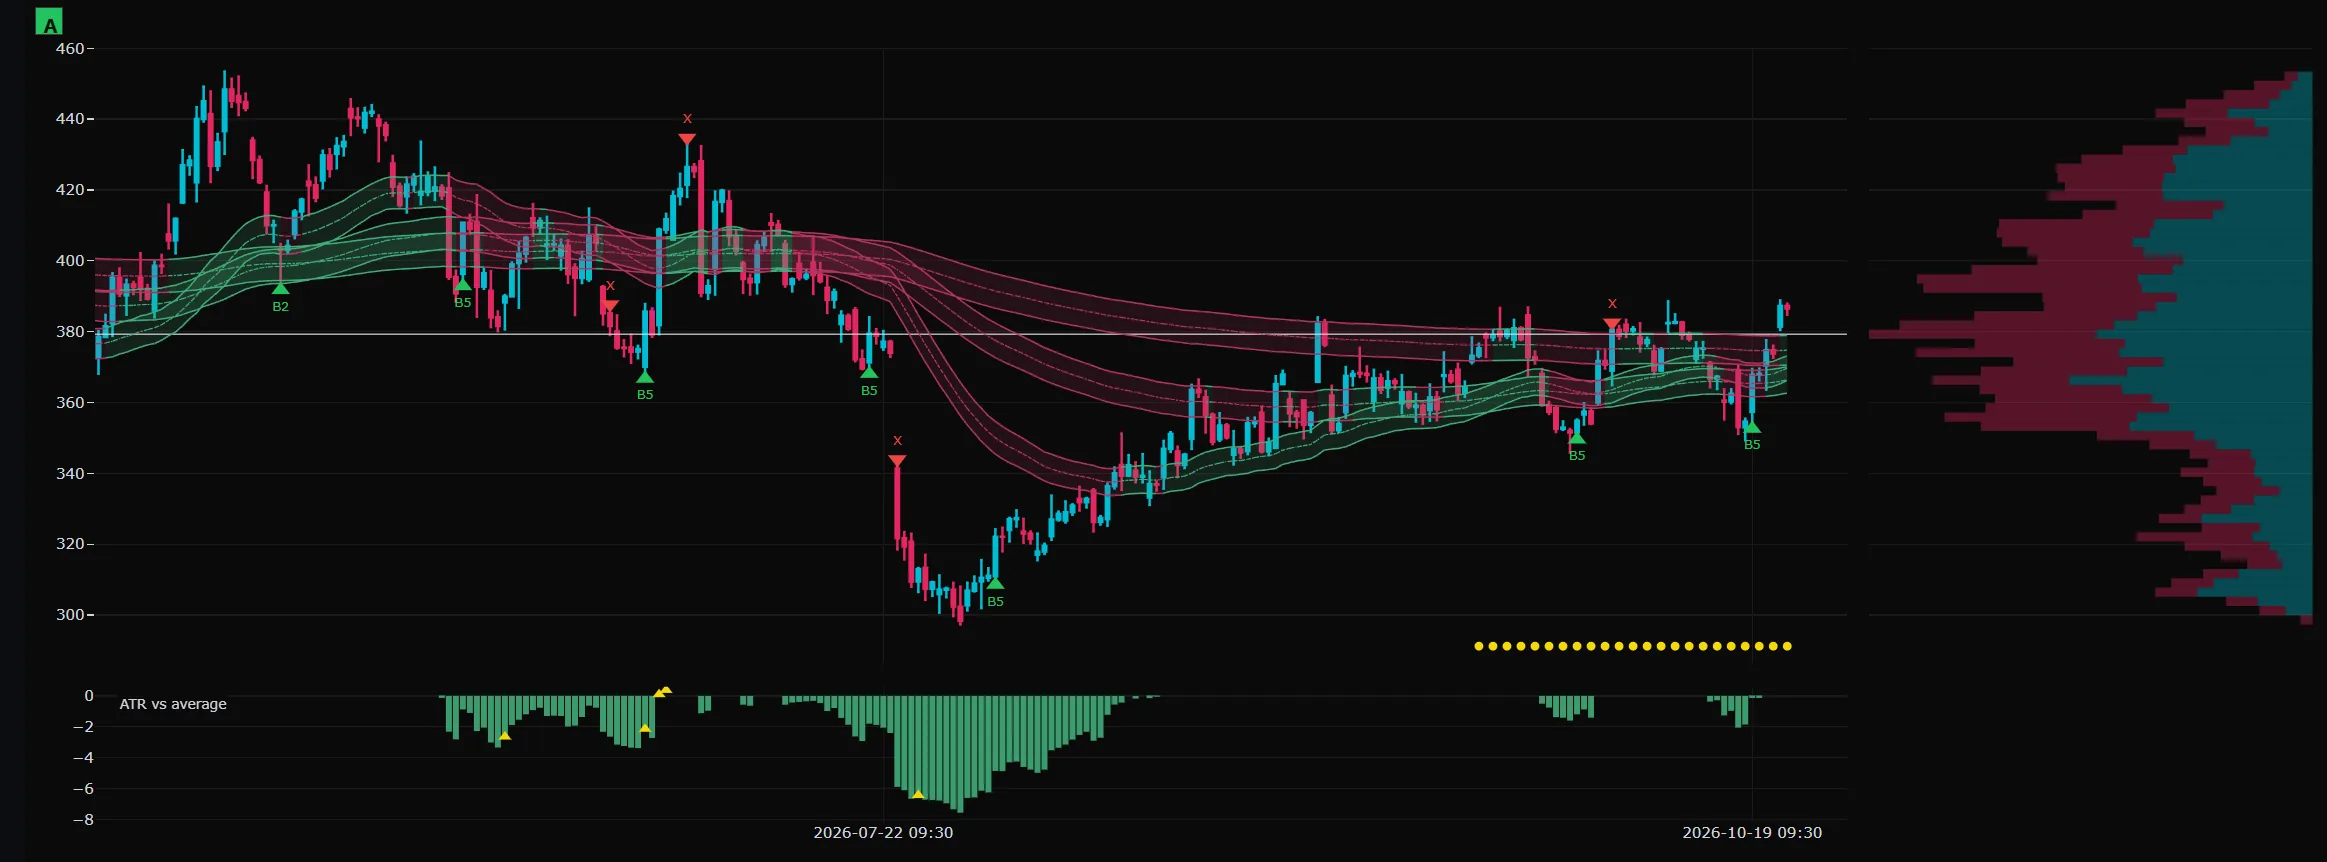
Tesla, TSLA
When Tesla dropped sharply this summer, the chart marks an exit on the first big down day, with the ribbons red through the fall. As the price turned back up, entries appeared near the lows.
A steady climb, with a plan
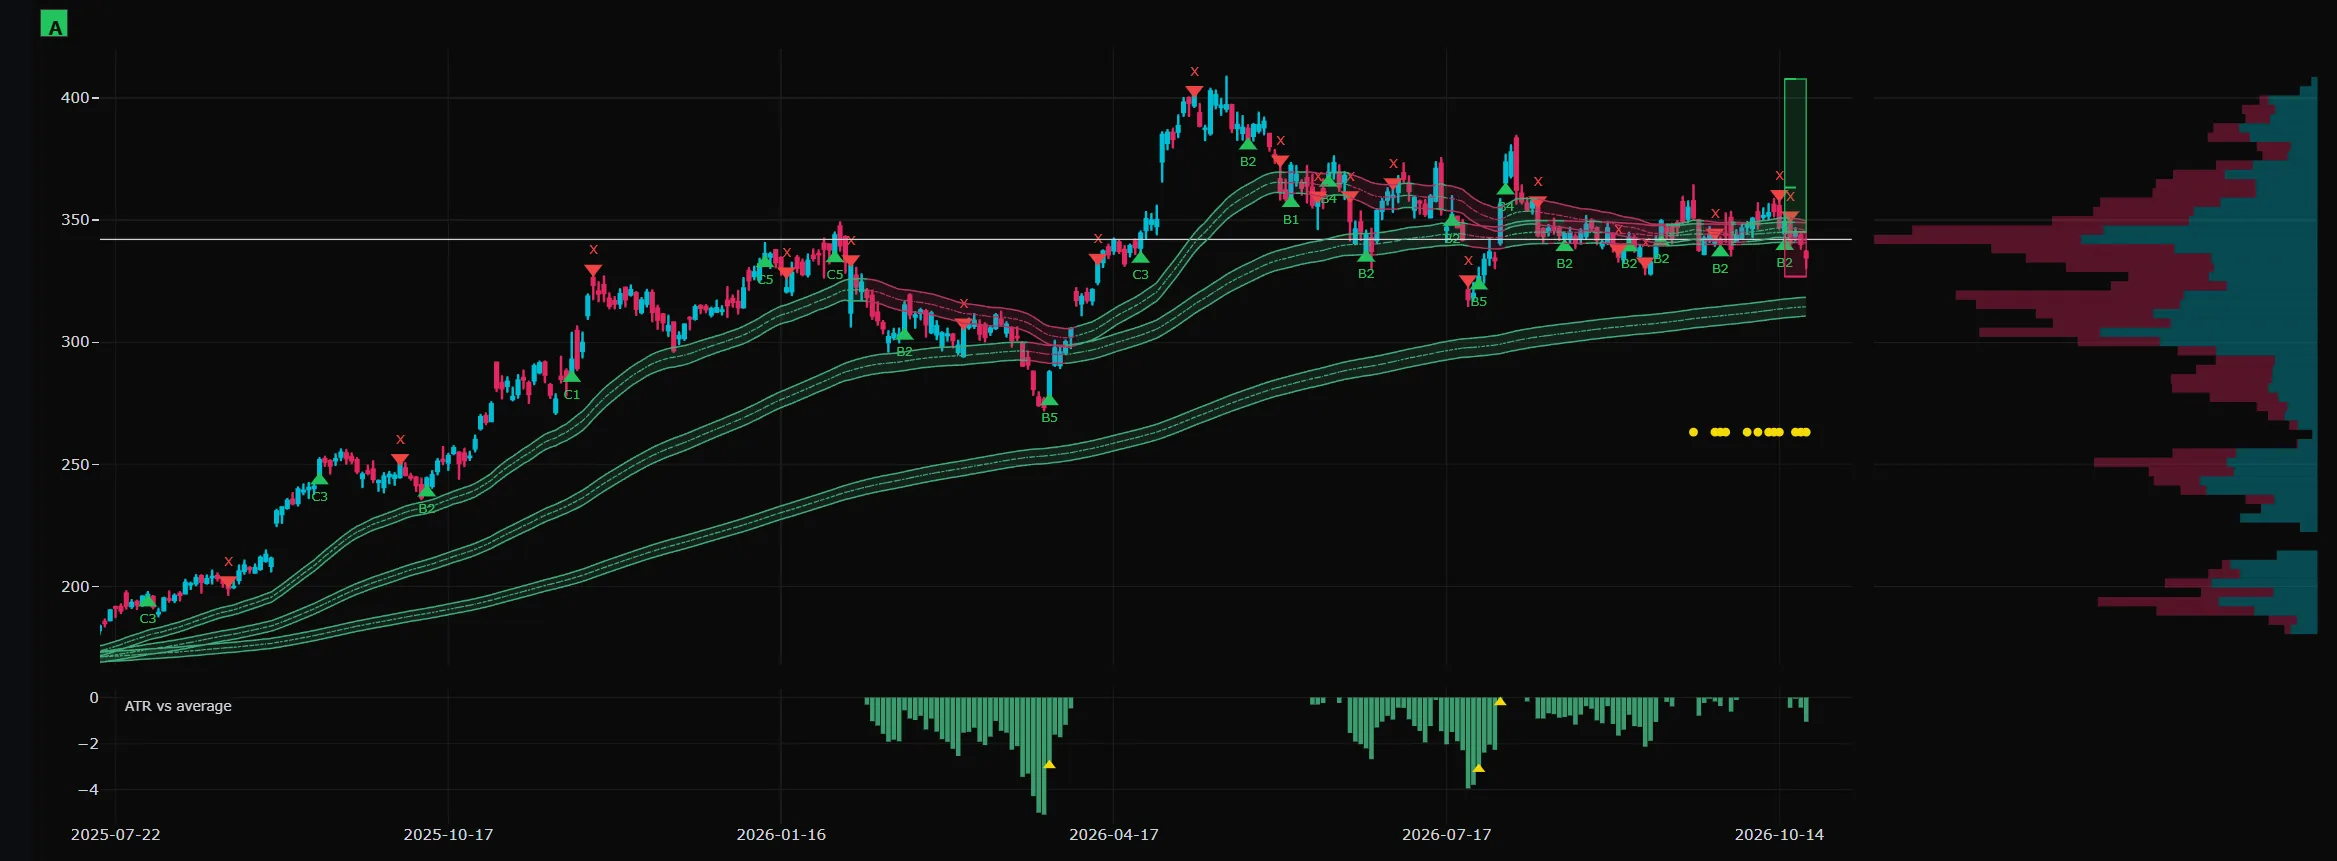
Alphabet, GOOGL
Alphabet climbs for months under green ribbons. Entries are marked on the dips and exits along the way, and the box on the latest bar carries the plan for the newest signal, with the target above and the stop below.
A breakout, followed through
Amazon, AMZN
Amazon spent months under red ribbons. When it broke higher this summer, the chart marks an entry on the breakout bar just as the ribbons turn green, and a second entry as the move extends.
Trade with logic, not emotion.
Request access to the private beta. I approve every account by hand.
O8Radar is decision support and is not investment advice. A signal is a probability, not a promise, and a stop does not guarantee an exit at that price: prices can gap past it. See Disclosures and risk.